Example Applications
Implementation simplicity with real-time insights for everyone
Example 1 - Anomaly Detection
The Anomaly Detection Engine (ADE), a Powered by AI application, enables anyone familiar with a comma delimited file to discover anomalies and build tailored applications rapidly, repeatedly, and to scale. We use multiple proven algorithms for both detection and automated optimization of tunable parameters so that you rely less on settings and more on findings.
You provide the data. The ADE runs autonomously, waits for incoming data files, and emails a Findings and Factors report in near real-time. A .csv file output readable by most analytical tools is also provided.
The ADE can provide you with an easy way to discovery data anomalies without requiring you to know what to look for.
- Quickly identify outliers in your data.
- Find the events and feature values that may be influencing risk, costs, outcomes, quality, etc.
- Visualize the specific factors within the data that contribute to anomaly classification.
- Optionally, read the results directly with your business analytics platform
In today’s world of distributed systems, managing and monitoring a complex system’s performance or outcomes is a chore. With hundreds or even thousands of items to watch, anomaly detection can help point out where trouble is lurking while speeding findings of root cause analysis. This is especially true if you can associate anomaly findings with outcomes of interest.
Sample Anomaly Detection on a simulated assembly line dataset.
- Workflow processes can often be characterized by measuring milestone event timing, such as interarrival times in a process workflow, or qualitative factors in a production line.
- The ADE can identify process metric anomalies such as an unexpected or rare value or pattern of values.
- Use this information to improve overall quality measures by creating new specialized workflows or controlling process variables to reduce process event variablity.
Dataset (sample from 10,000 rows)
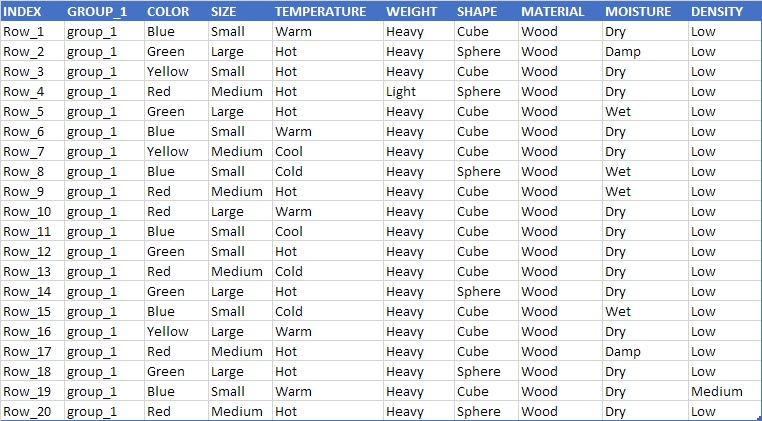
Anomaly Detection Engine Sample Data
Example 2 - Classification/Prediction
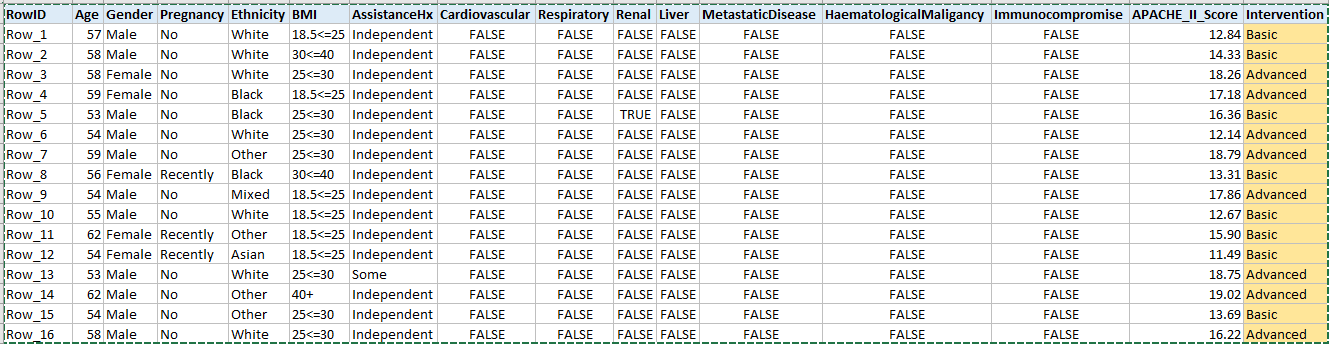
Sample COVID-19 Critical Care Study for Predicting Need for Mechanical Ventilation
The ability to accurately predict the number of needed ventilators is one important aspect in the managment of this disease. Machine Learning has the ability to leverage the various data points needed to create a predictive model. This study was based on statistical data reported by the ICNARC report on COVID-19 in Critical Care on 04-APR-2020. Table 2 of this report characterizes those critical COVID-19 patients who needed 'Basic' respiratory intervention and those who needed 'Advanced' intervention (need for mechanical ventilation). A patient dataset was synthesized (n=2000) based on the published statistics and a predictive model for the type of respiratory intervention was generated.
------------------------------------------------------------------------------------------------------------
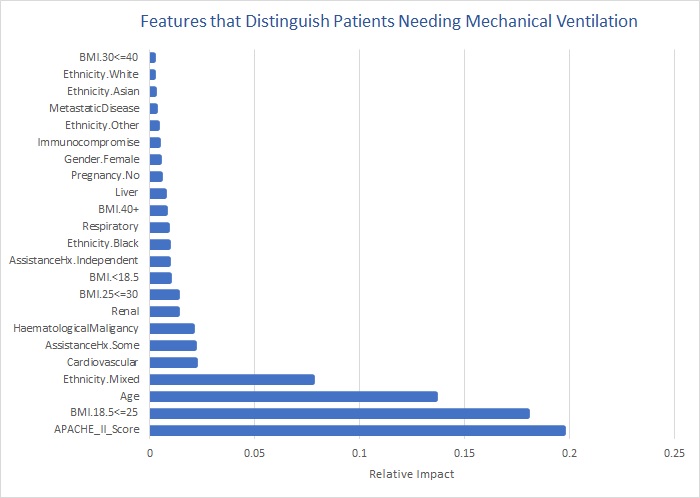
Cross-validation metrics for the learned Multi-class Classification model for the ability to classify the need for advanced respiratory support:
Average MicroAccuracy: 0.823 Standard deviation: (0.013 - Confidence Interval 95%)
Average MacroAccuracy: 0.758 Standard deviation: (0.021 - Confidence Interval 95%)
Below is a chart that depicts the predictive strength of various factors that were measured within the cited population study.
Example 3 - Prediction
Sample HCAHPS Quality Ratings Study
The sample below shows encounter data coupled with healthcare HCAHPS survey results. In this example, all encounter data features are categorical. Use as many categories (columns) as you wish; however, use only the minimum number of categorical values as possible within each category. For instance, if the answer to a question is 'sometimes' or 'usually' that answer should be rolled up to a single category. In our example below responses of 'sometimes', 'usually, and 'never' were rolled up to a category of 'Other'. A good practice is to not use categorical values that do not help distinguish between outcomes of interest. In this case we were only interested in distinguishing leading factors between 'Always', the only desired response, and all other responses.
This is the question:
"During this hospital stay, how often did nurses explain things in a way you could understand?"
So what are the results?
Although Table 1 below consists of only 100 samples and 8 encounter features it is difficult to manually identify which factors most distinguish the undesired response of 'other' from the desired response of 'Always'. View the table below. For us humans there are too many inputs, too many outputs, too many anomalies and randomness. We would never be able to determine, from looking at the data, what data relationships can predict the outcome. However; machine learning is able to train on 80% of this data and predict the response label (outcome) of the other 20% with 96-100% accuracy and tell you what findings it used in prediction!
We can use a series of rules derived from machine learning to implement process interventions designed to improve patient satisfaction. For example; we may learn that a particular service line and staff shift are strong factors in a negative survey response. One can then focus on those process areas for a positive impact on survey results.
Table 1 - Simulated encounter and HCAHPS results data
See the findings used in prediction of survey results!
Standard Data Preparation
- Prepare a comma delimited file.
- The first row shall contain a Header so that each column (feature) is a label for the type of data in the column. The label for the first column in the Header is the label for the row index column. It can be anything you like, such as ‘Row#’ or ‘INDEX’, etc. All header labels shall begin with a letter.
- The left most column in data rows ‘Column1’ must contain the unique row identifier. This identifier must begin with a letter.
- Rows can be sequenced in any order.
- Except for the first column all other columns shall contain nujmerical or categorical feature data only.
- FoundationDx can automate the data preparation step as part of a non-recurring development charge.
Categorical features must begin with a letter and are those where there is no order between the possible values for the variable (i.e. there is no order relationship between Sunny and Rain, one is not bigger nor smaller than the other, but are just distinct.